Atlantis GPT Progress Report | July 17
Summary
This week the engineering team extended the capabilities of our LLM based service across multiple fronts.
Functionality was expanded to support user authentication, user profiles, and chat history, as well as to allow chat history and large vector database to be used as sources of context for more contextual LLM responses.
The user experience has been dramatically improved by moving our LLM into a GPU powered Azure server and adding streaming tokens. Previously the LLM would take 45-60 seconds to begin delivering a response to the user. With the GPU enabled server, responses are now delivered in 5-10 seconds from the base model.
In addition, a refresh of the UI/UX is in flight. The current UI/UX has been a great starting point as our initial efforts focused on fundamental LLM technologies. As those efforts begin to reach a steady state, we are shifting efforts toward a more modern UI/UX.
Substantial progress was also made in managing our foundational architecture and CI/CD pipelines, making our systems more resilient and development faster in the long term.
Accomplishments
LLM Architecture and Backend Development
To reduce response times, the team provisioned dedicated cloud hosting from Microsoft Azure that utilizes Nvidia Tesla T4 GPUs at a fraction of the cost of a similar offering from Amazon Web Services. These servers are not readily available in the market, and required us to work directly with Microsoft support to gain access. Our application’s user experience has dramatically improved using this hardware.
To further improve the user experience, we leveraged new capabilities in LangChain so that AtlantisGPT now streams tokens to the browser when providing responses. Rather than waiting for the entire response content to be finished and sending the whole result to the user’s screen, a user will see words appearing as they’re generated by the system. This provides a much better user experience.
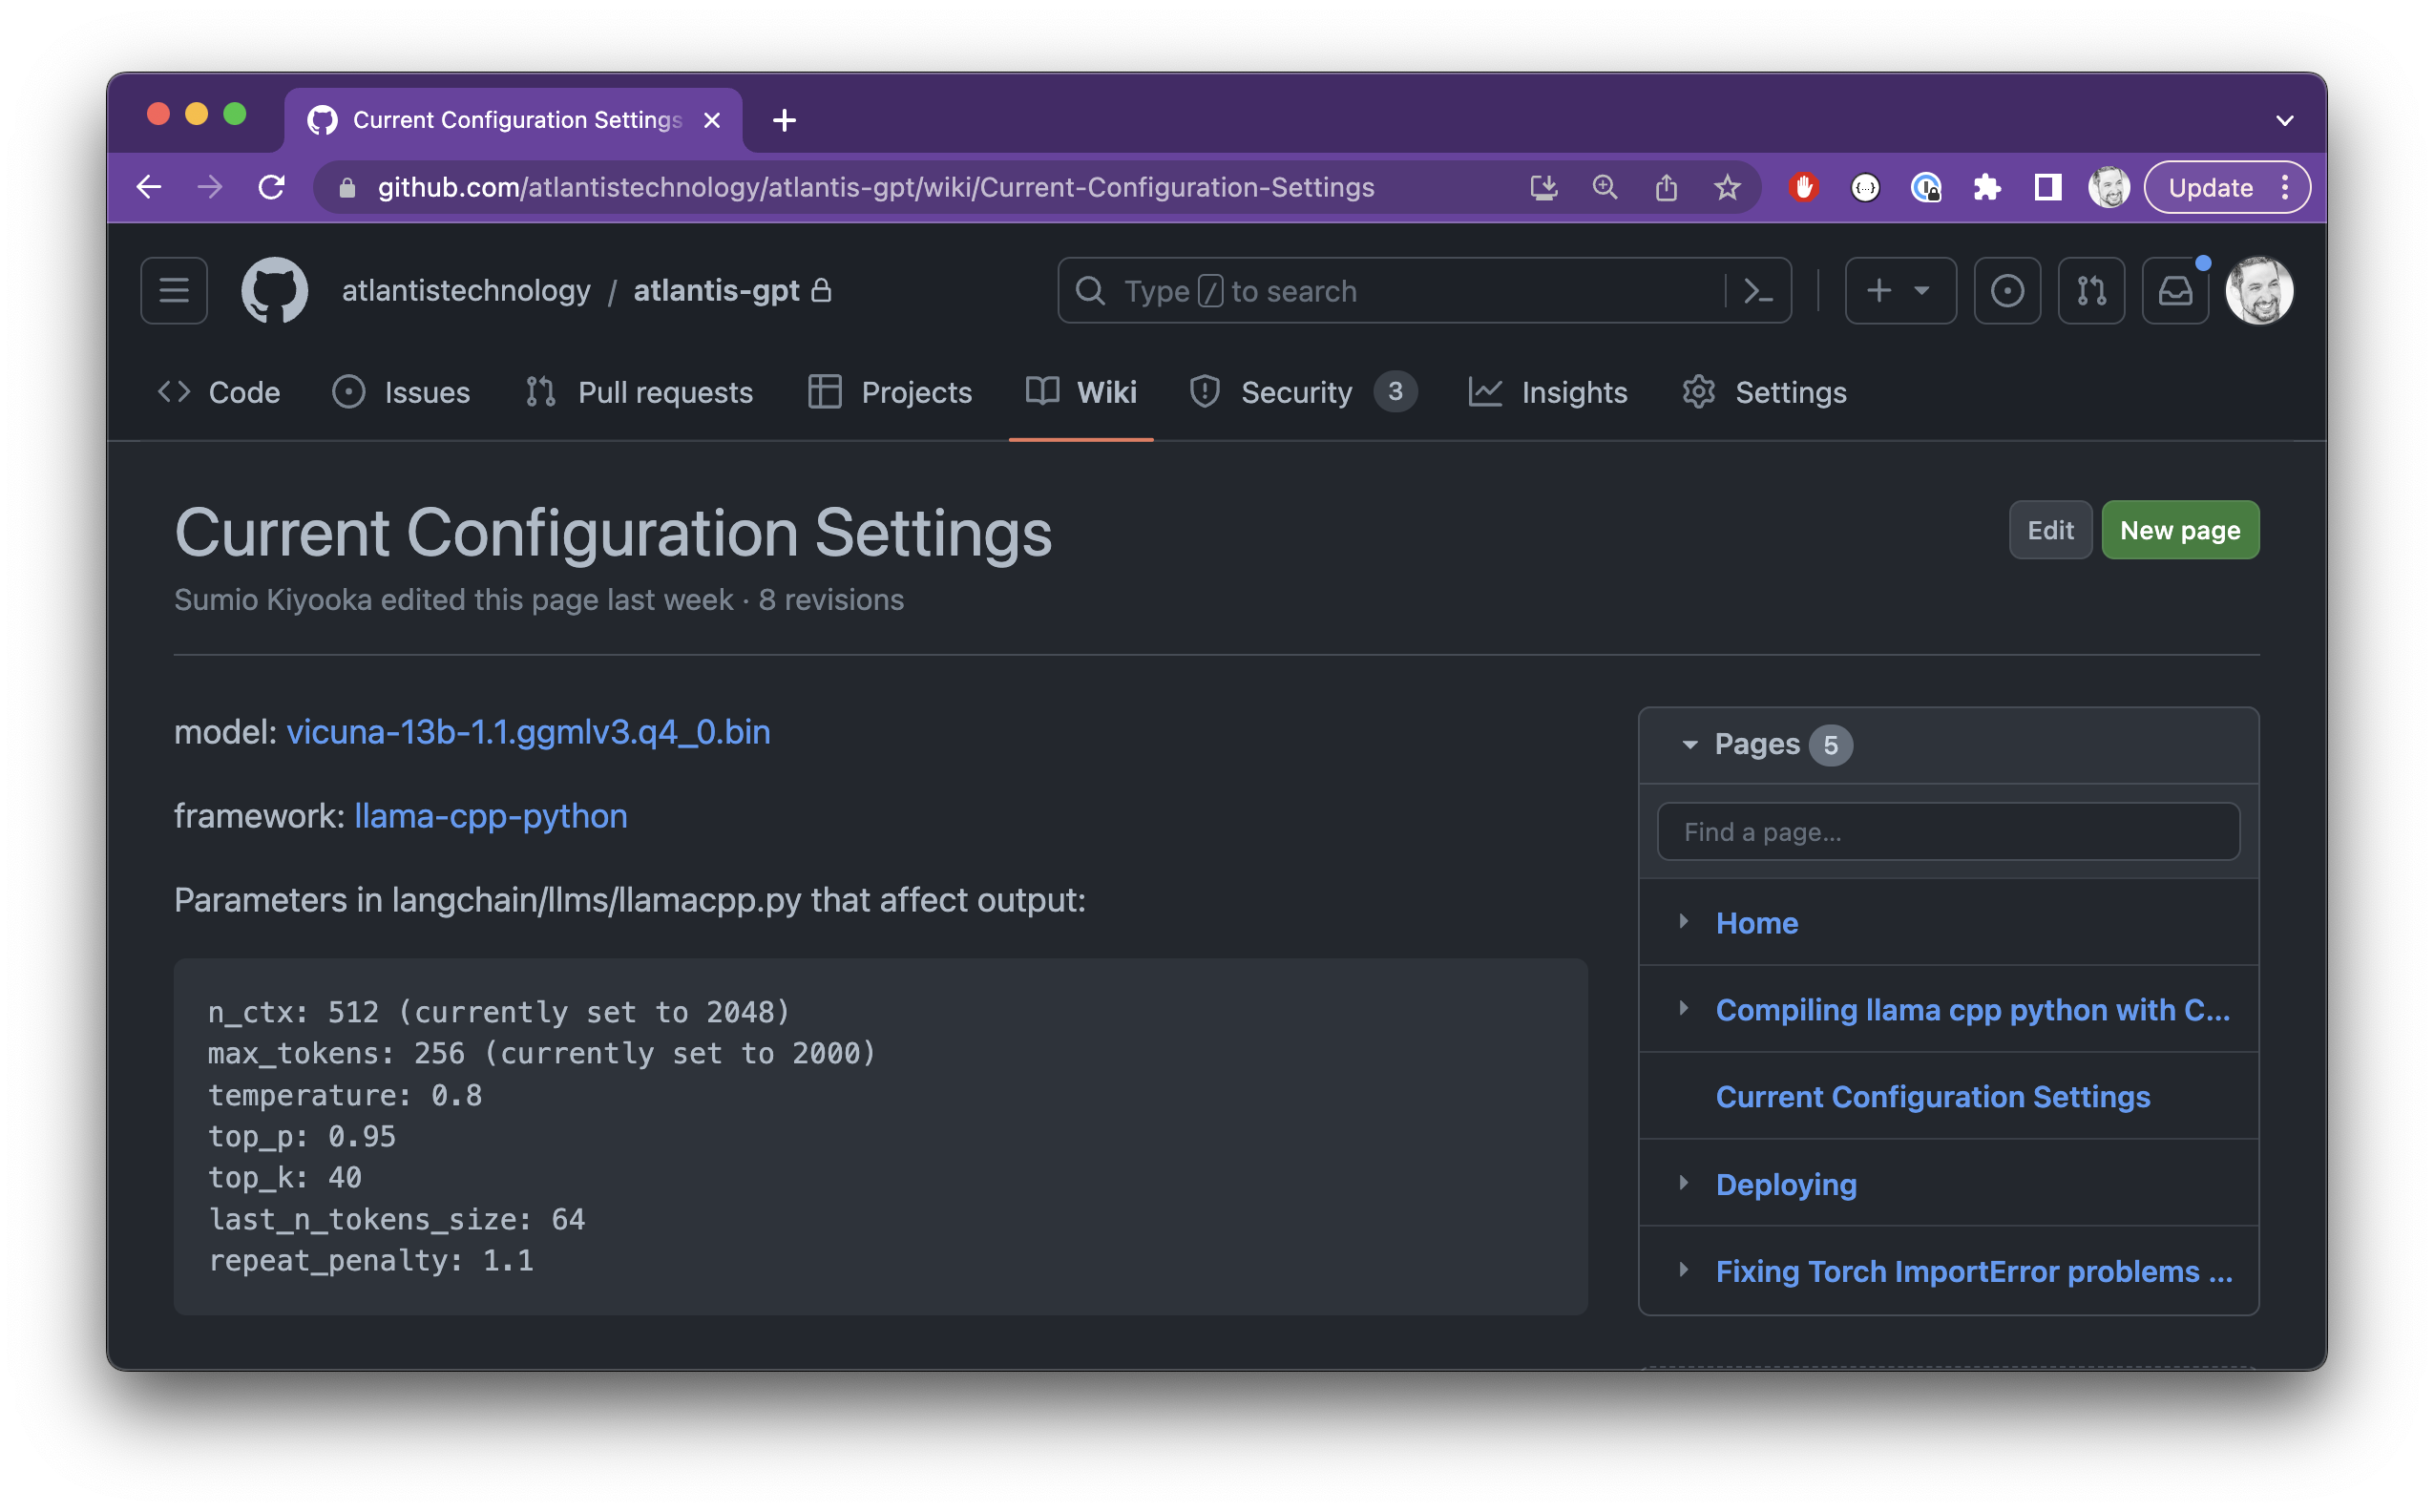
To record and socialize the parameters that we’re using in the development environment, we’ve instantiated a Wiki page that the entire team has access to. The purpose of this page is to be the source of truth for the current LLM configuration.
We are implementing Zep as a server-side application to facilitate leveraging chat history and sessions as context. Zep serves as a long-term memory store for LLMs. The latest version of Zep allows for the leveraging of local models, whereas previous versions leveraged OpenAI’s API. With these latest updates, we can now leverage Zep in a protected manner in our own environment.
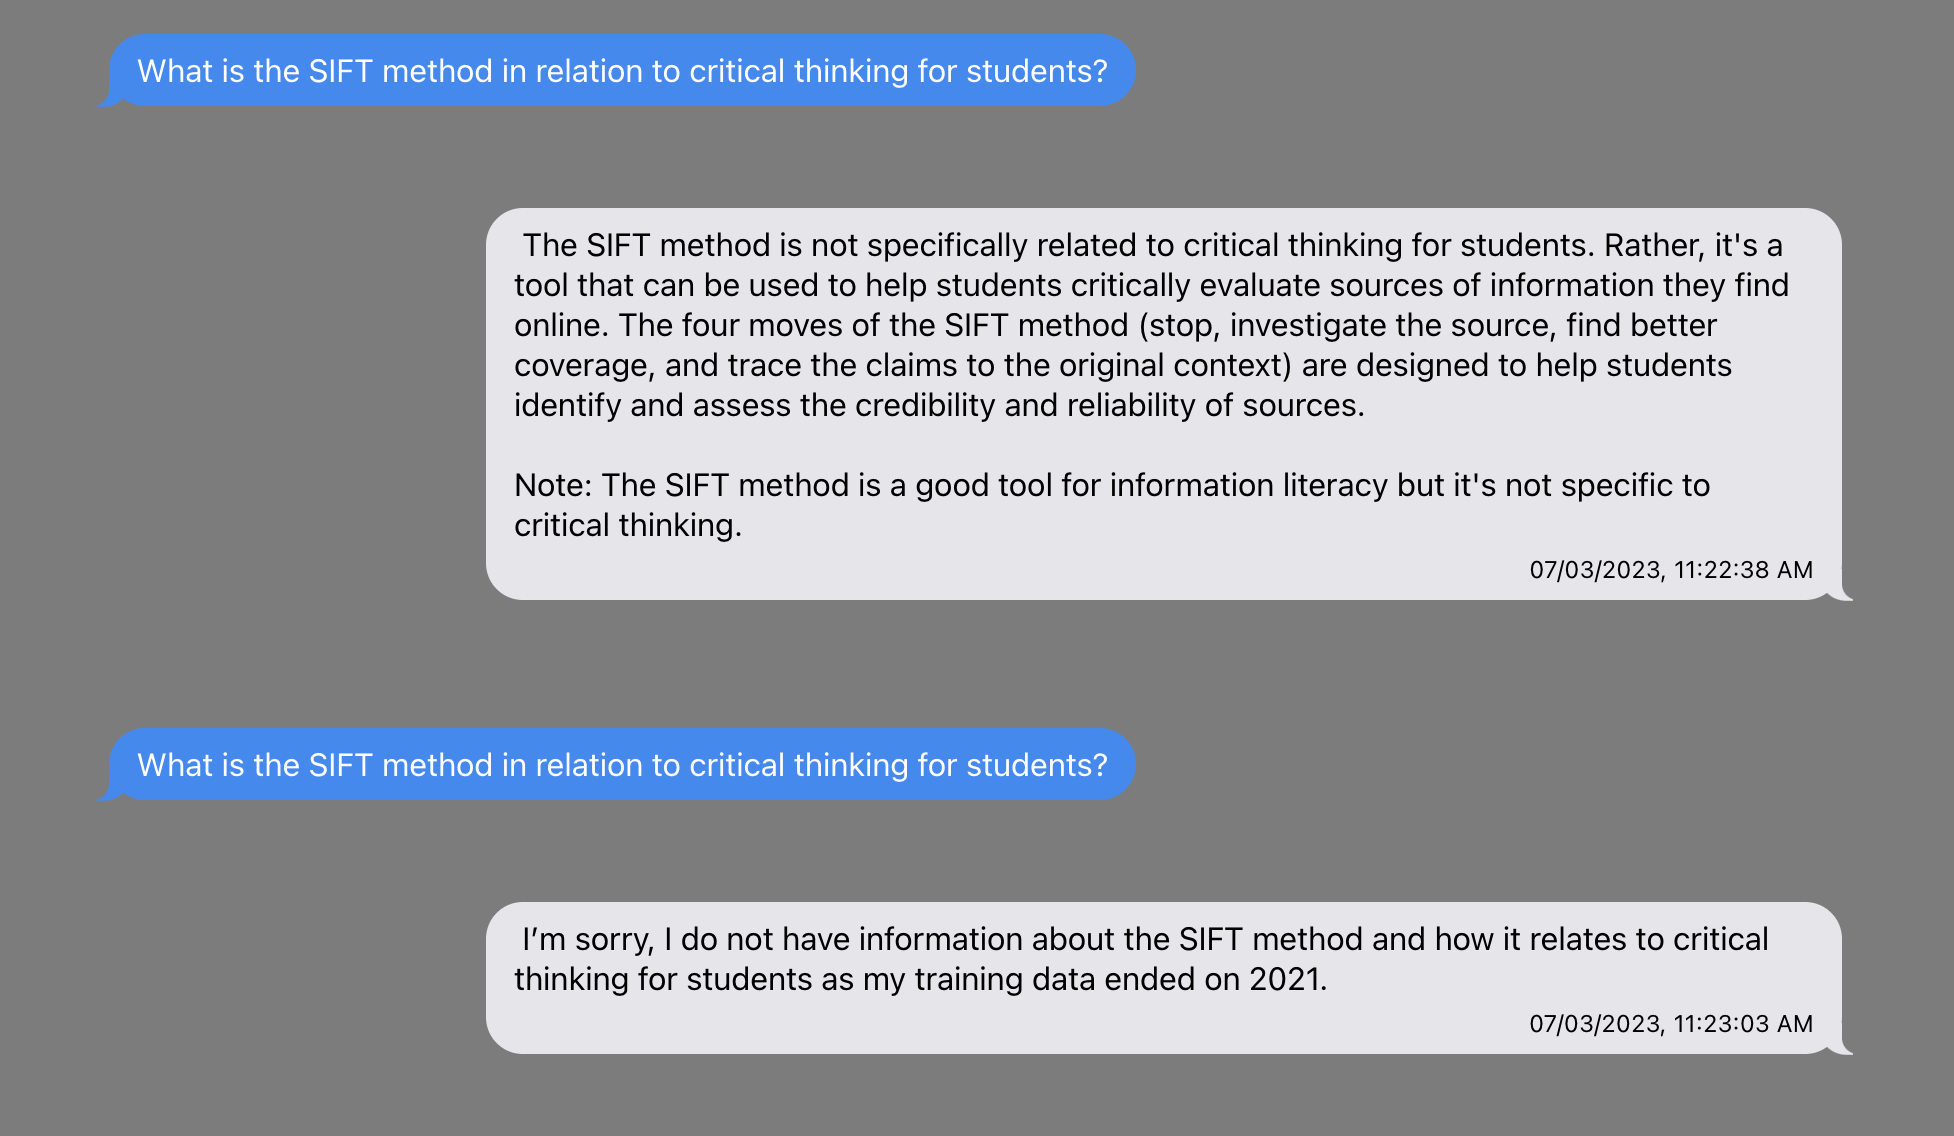
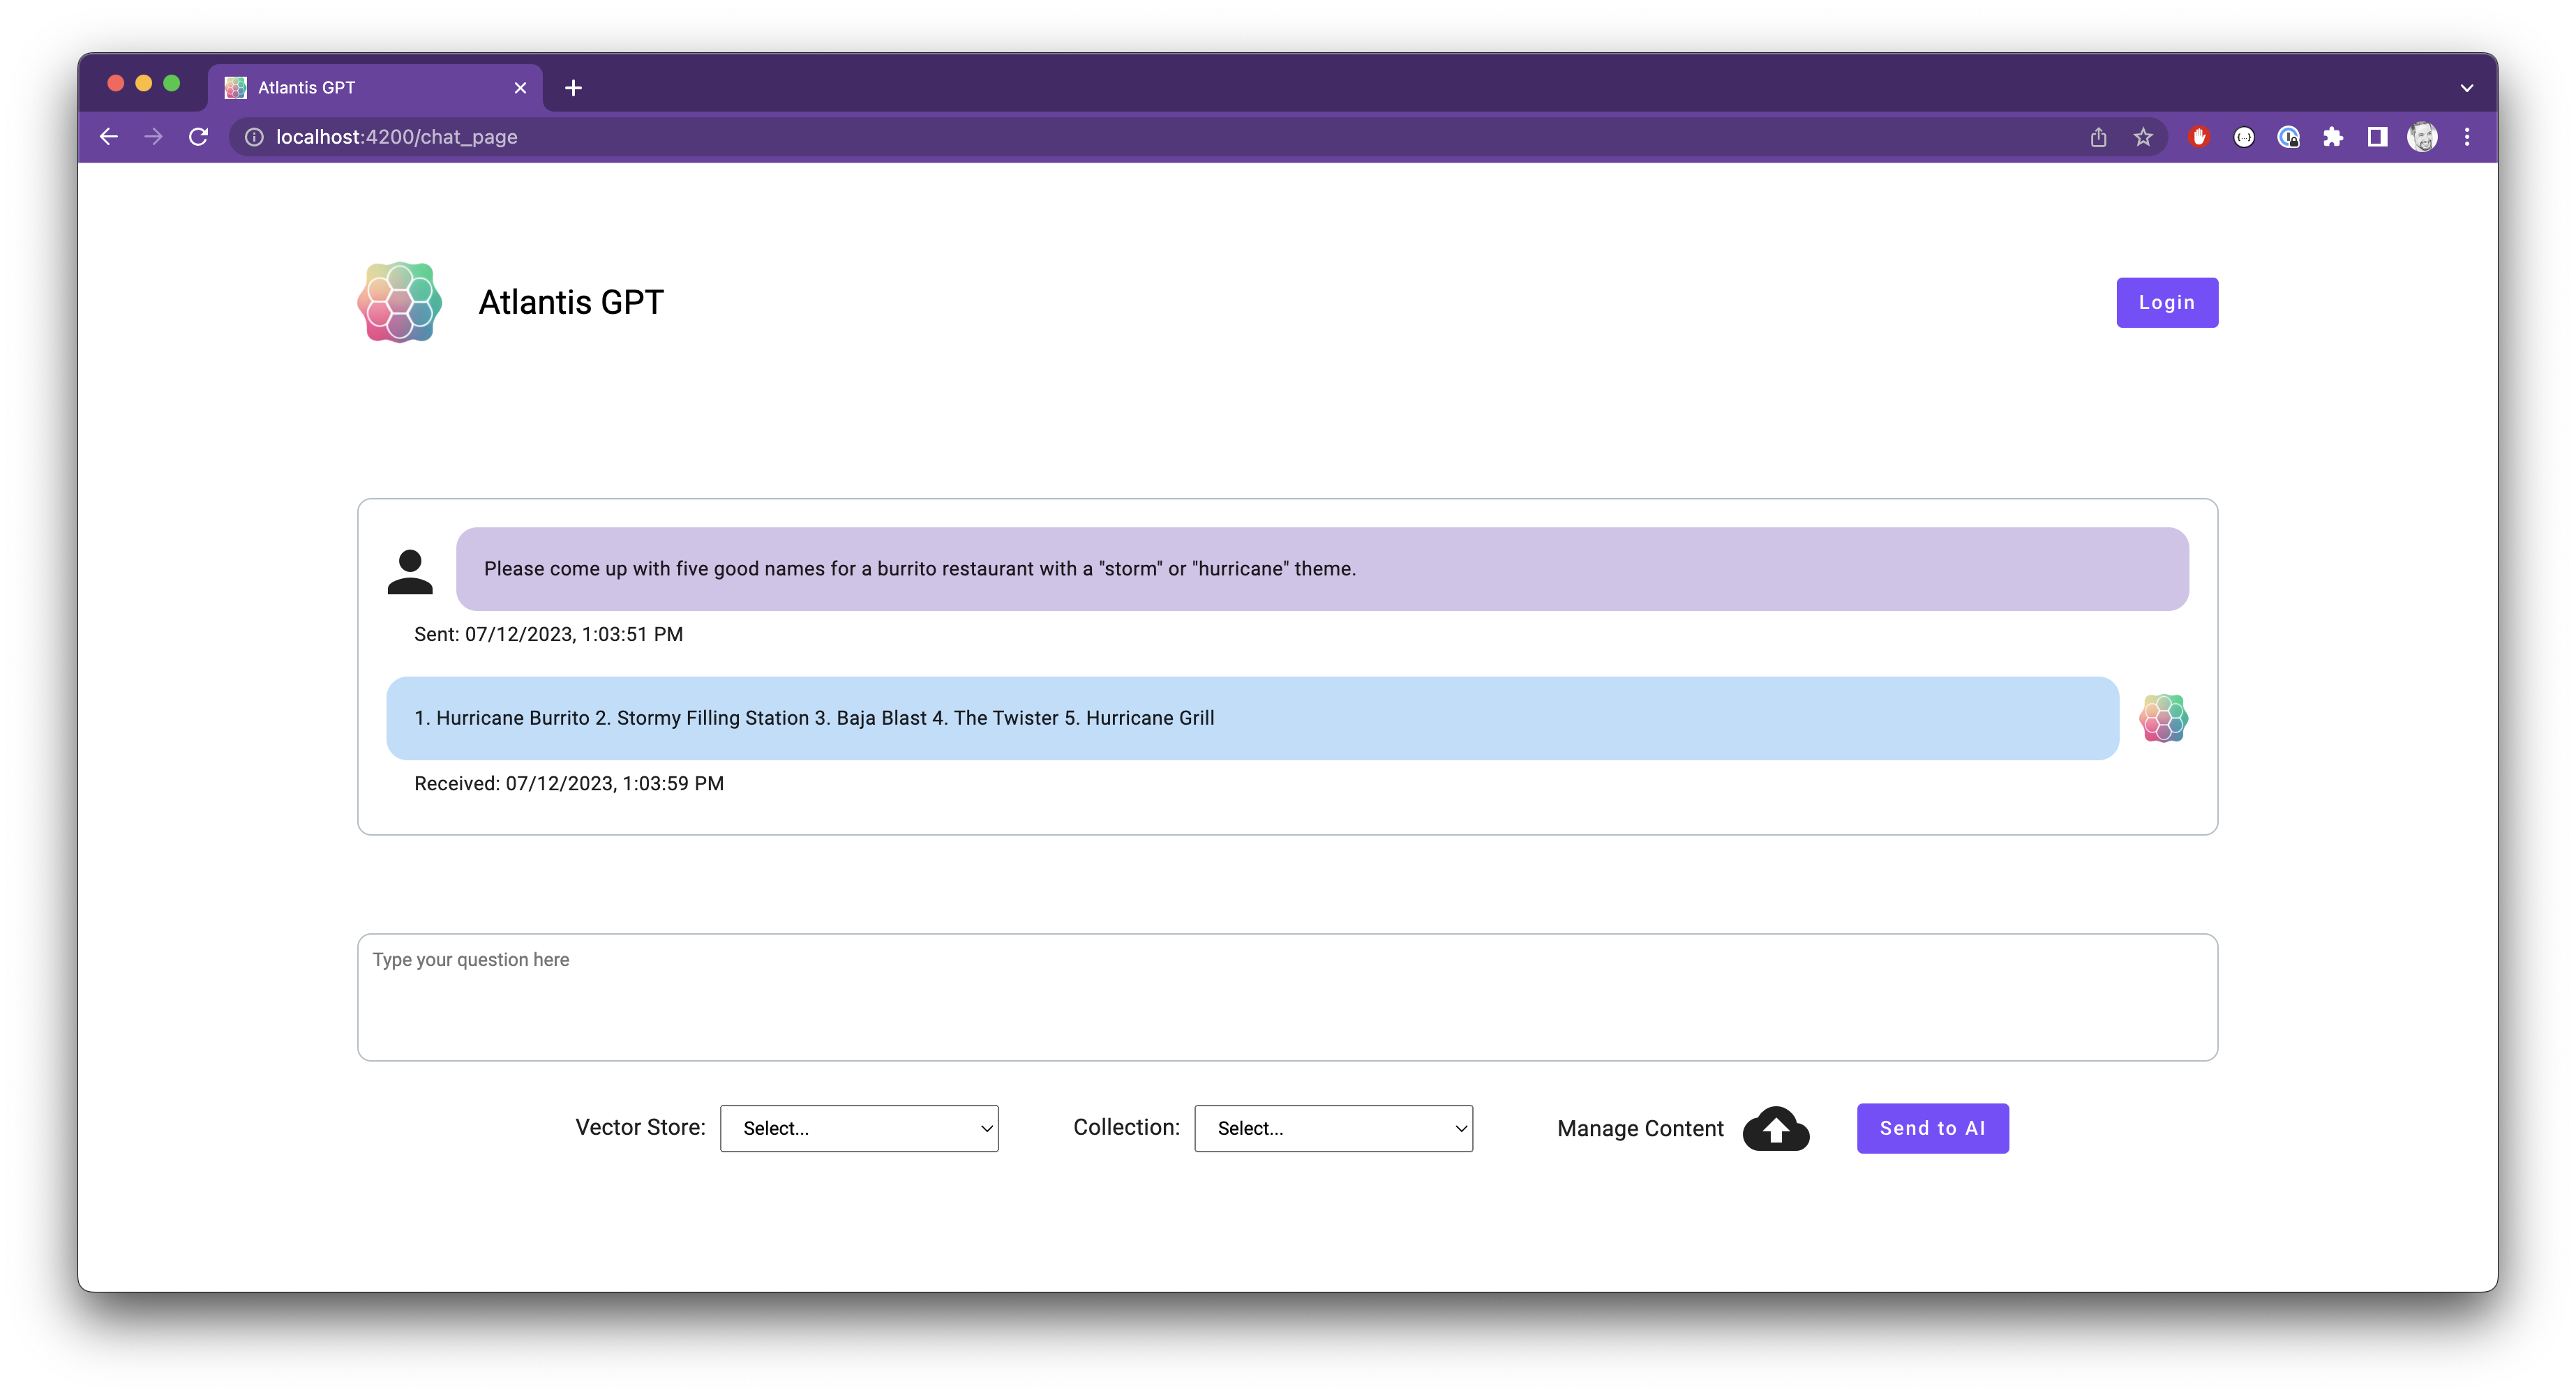
By adjusting the configuration of our application servers to accommodate larger data payloads, the team has successfully scaled up the size of documents that can be ingested into the vector database. This will allow us to use substantially larger sources of data such as textbooks and lengthy reports as context. This context is important as it can provide additional data for the LLM to leverage when providing answers. As an example (seen below) you can see a comparison of the answers provided by the base model of an LLM after toggling the vector database between prompts, versus one that had an open source philosophy textbook for added context.
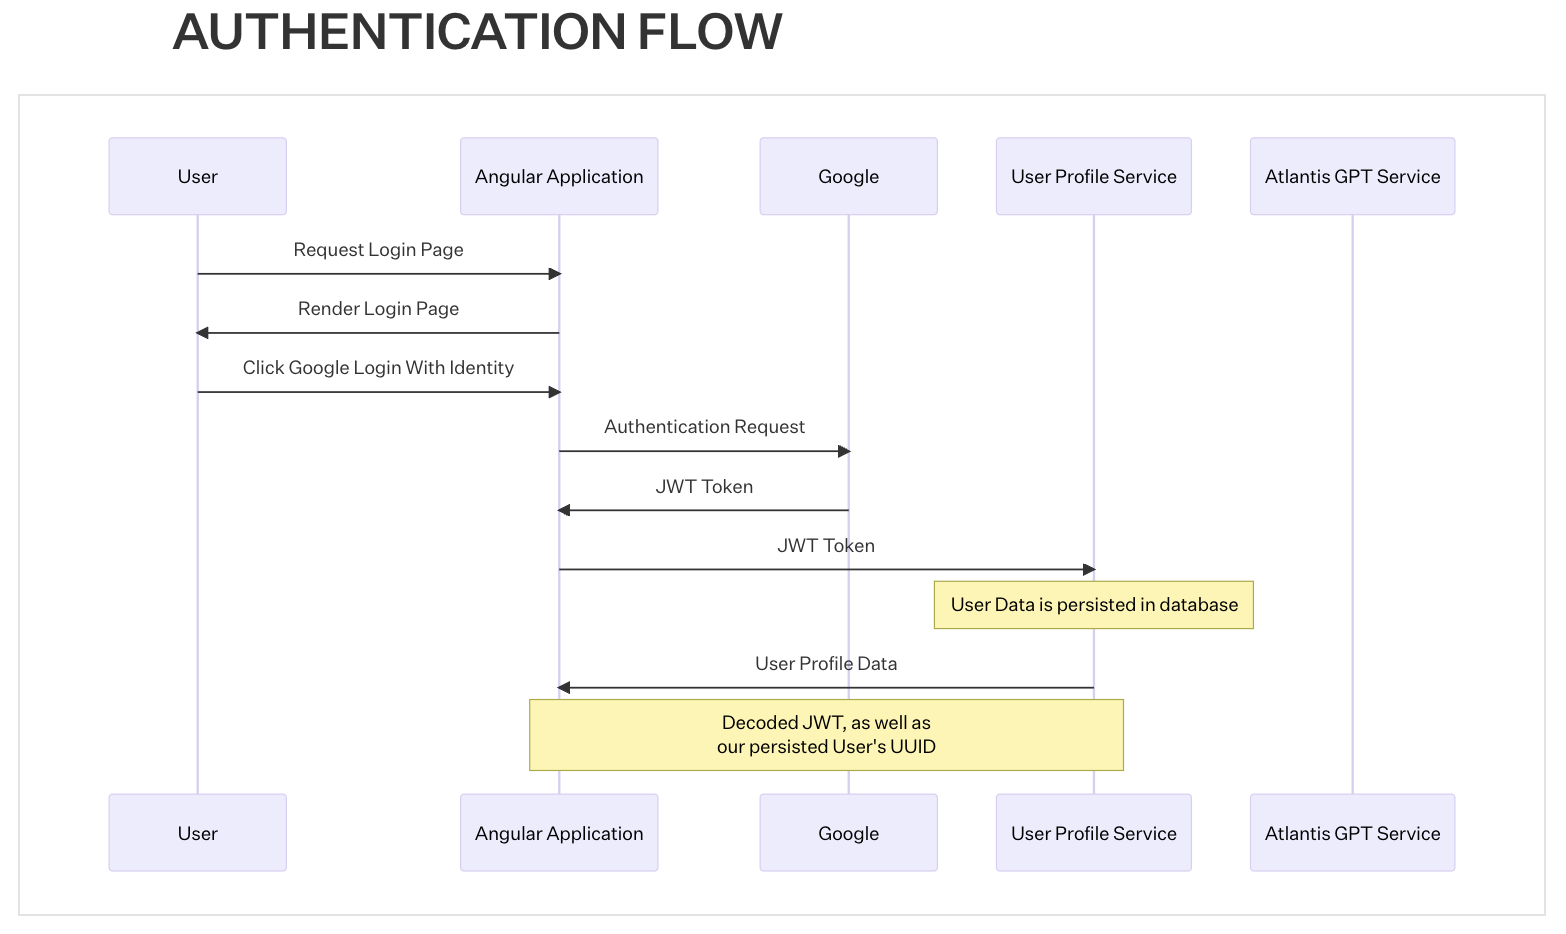
The development team outlined the Authentication Flow for Users and Conversations, which are visualized in the sequence diagrams below. These are detailed in our Engineering Design Documentation.
This design of the Authenticated User flow will accommodate Google authentication with minimal effort and allow for more robust authentication methods in the future. The approach implements a dedicated User Profile Service, which is responsible for persisting user profile information.
With our Authentication Flow confirmed, a Ruby on Rails Application has been set up to support User Authentication and Profiles. This will allow individual users to have their own segregated conversations, sessions, and Vector database sets. The infrastructure will initially leverage Google Authentication. Our expectation is that every instance of the GPT that is implemented will have it’s own fresh User Management configuration. We also expect that most instances in corporate environments will leverage a variety of authentication tools such as Okta.
Front End Development & UI/UX
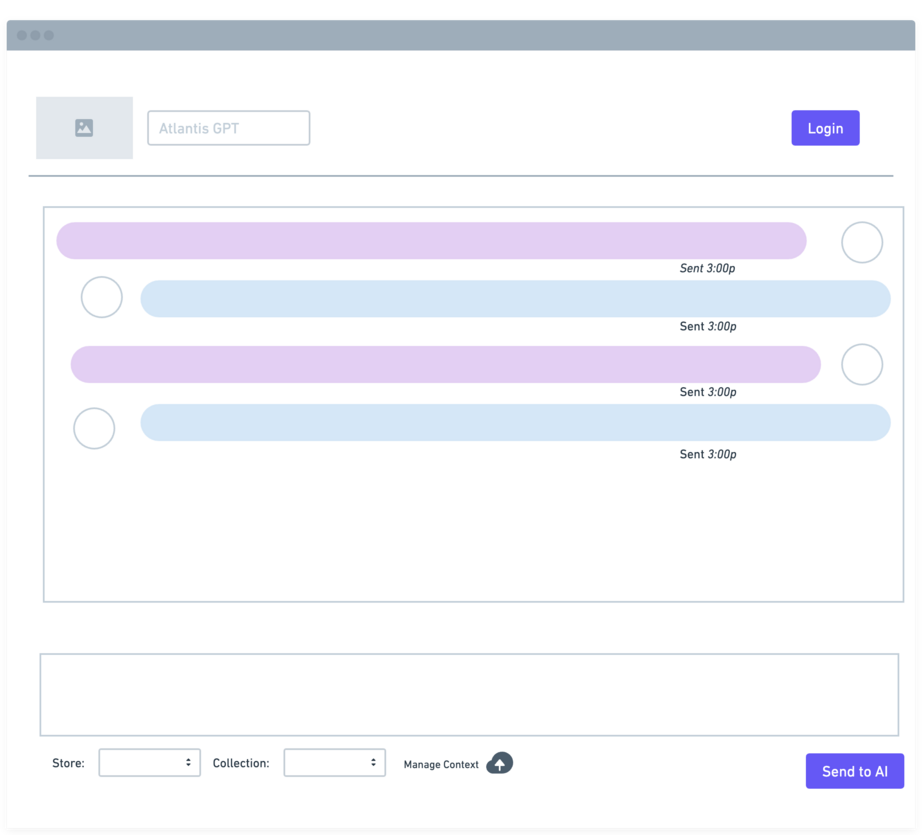
Additional wireframes are in flight and the team continues to add polish to the front-end experience of the chat interface.
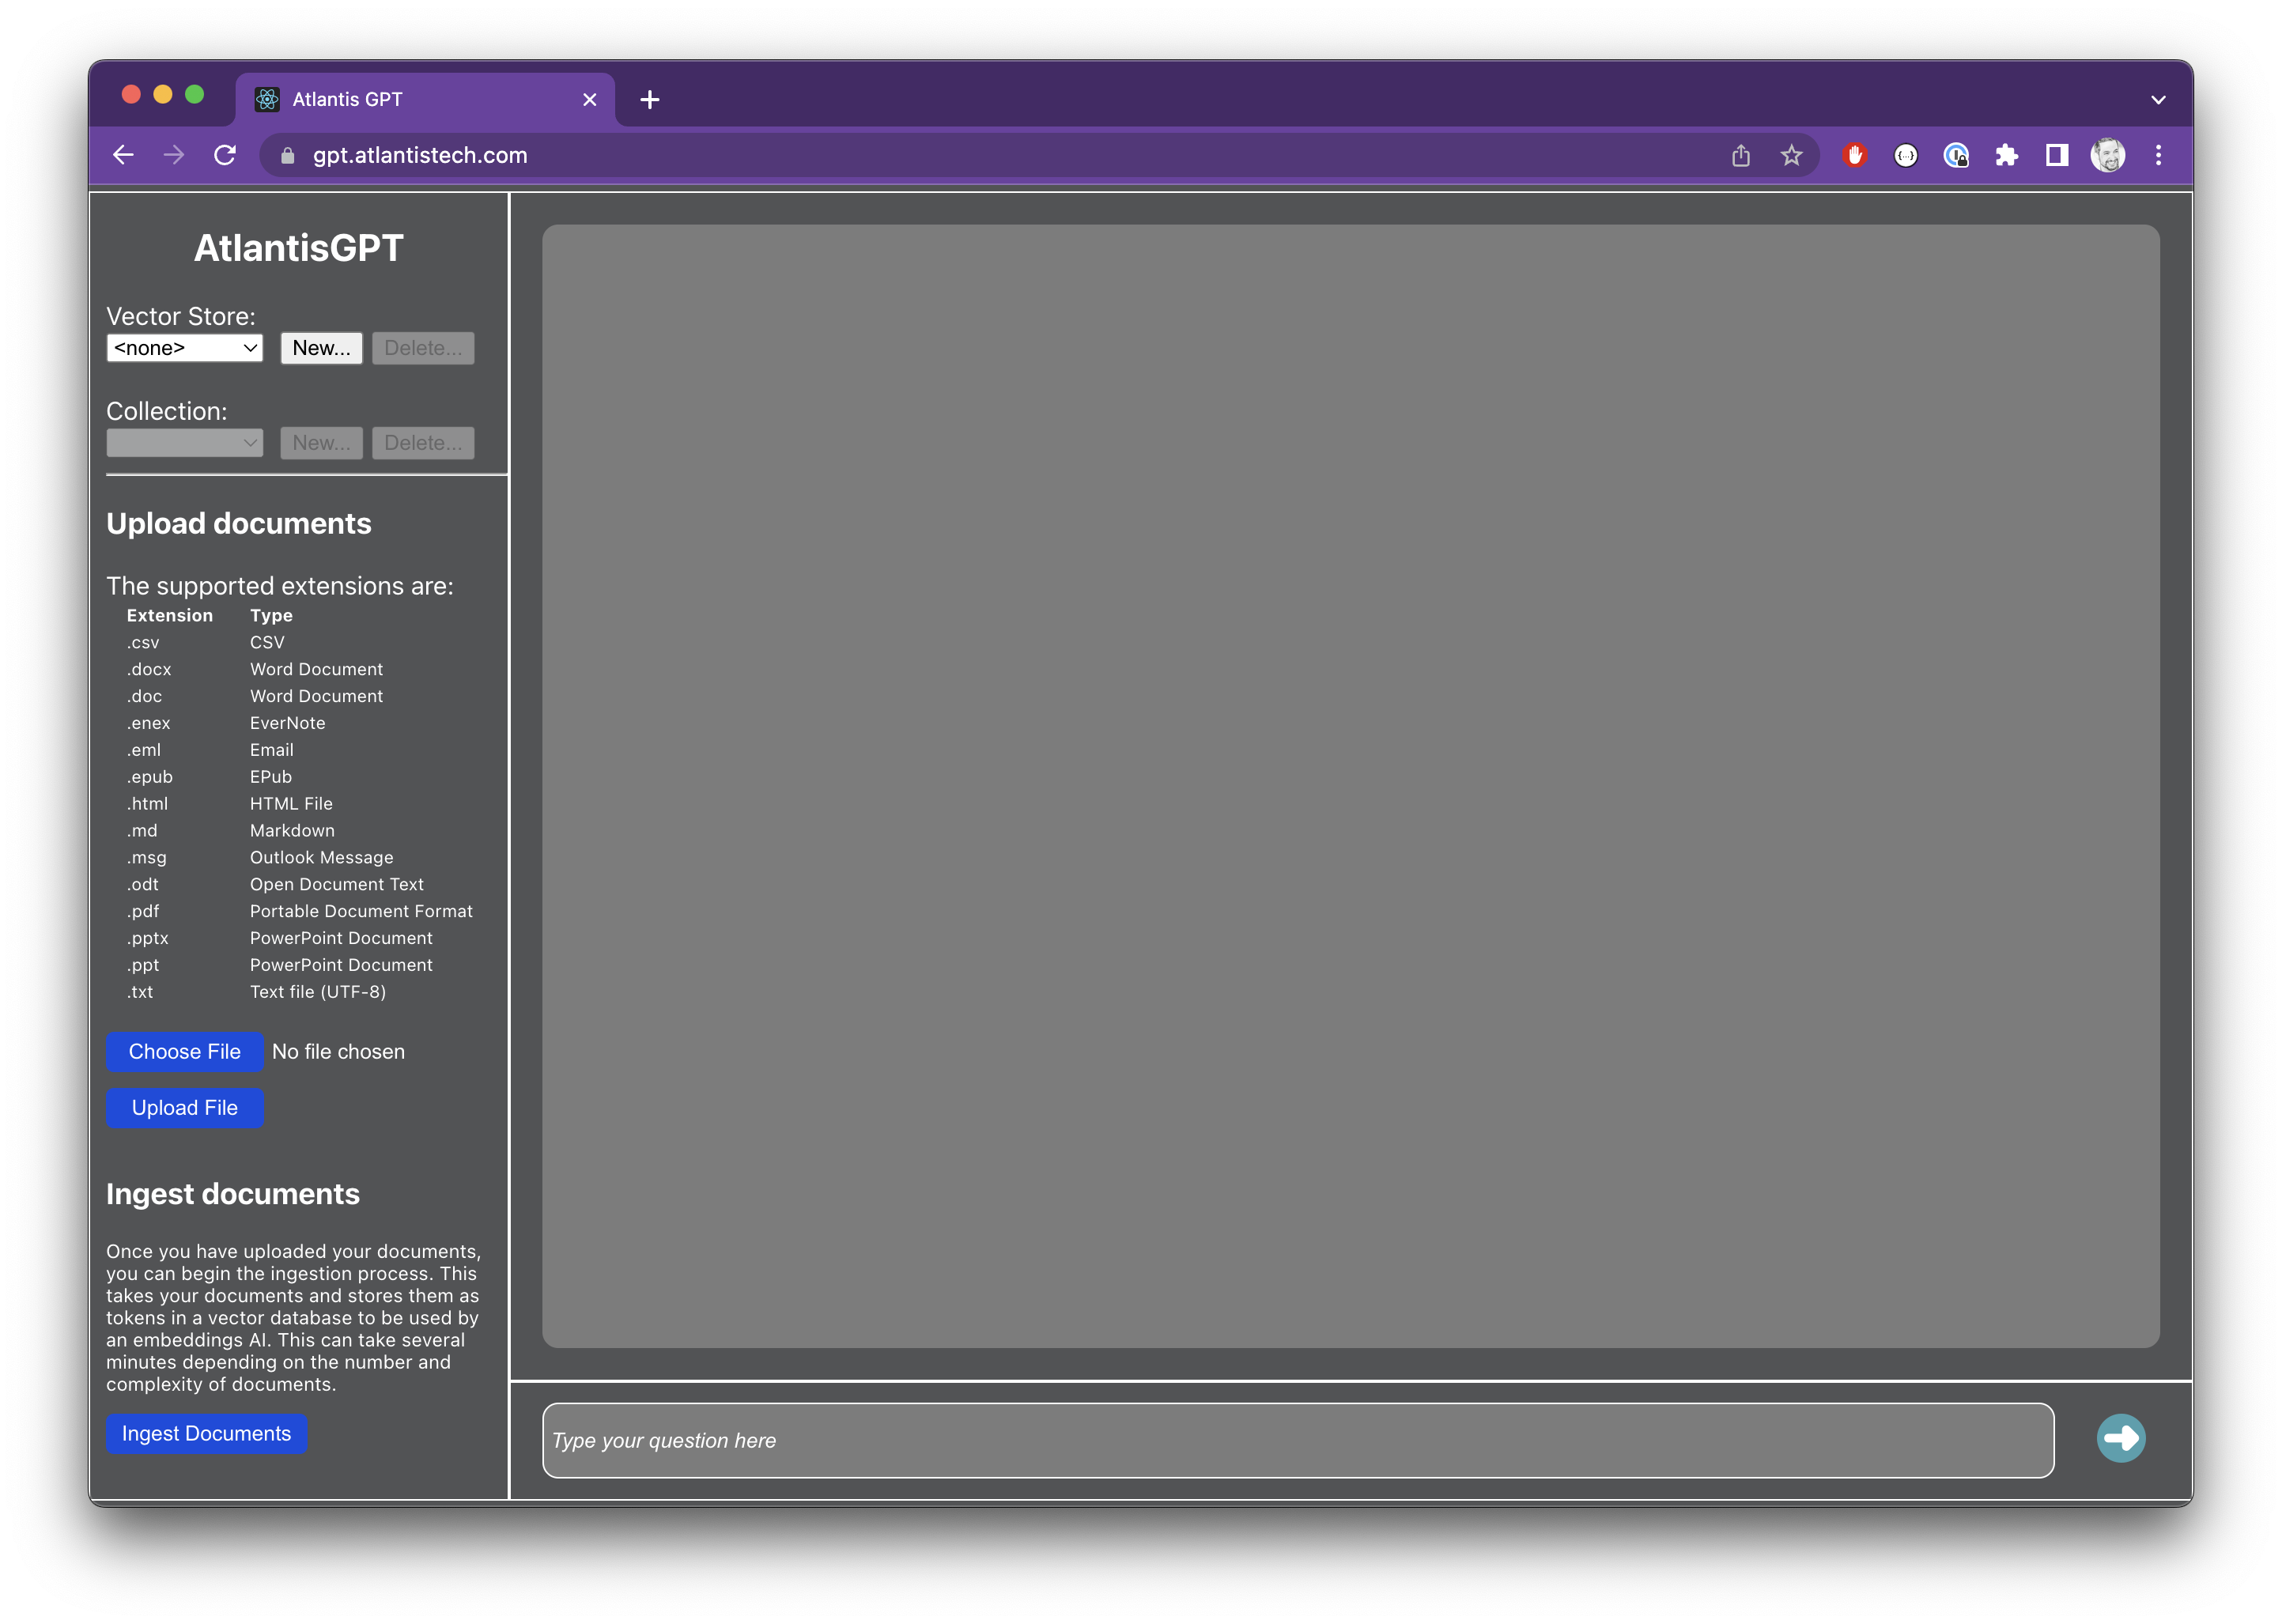
Starting with the initial prototype experience (screenshot above), we created a mockup that targeted a more user-friendly experience that should look and feel more like a typical chat experience with bright and welcoming colors.
The new design provides a more welcoming experience and will be available in the QA environment for evaluation in the coming weeks.
Infrastructure & DevOps
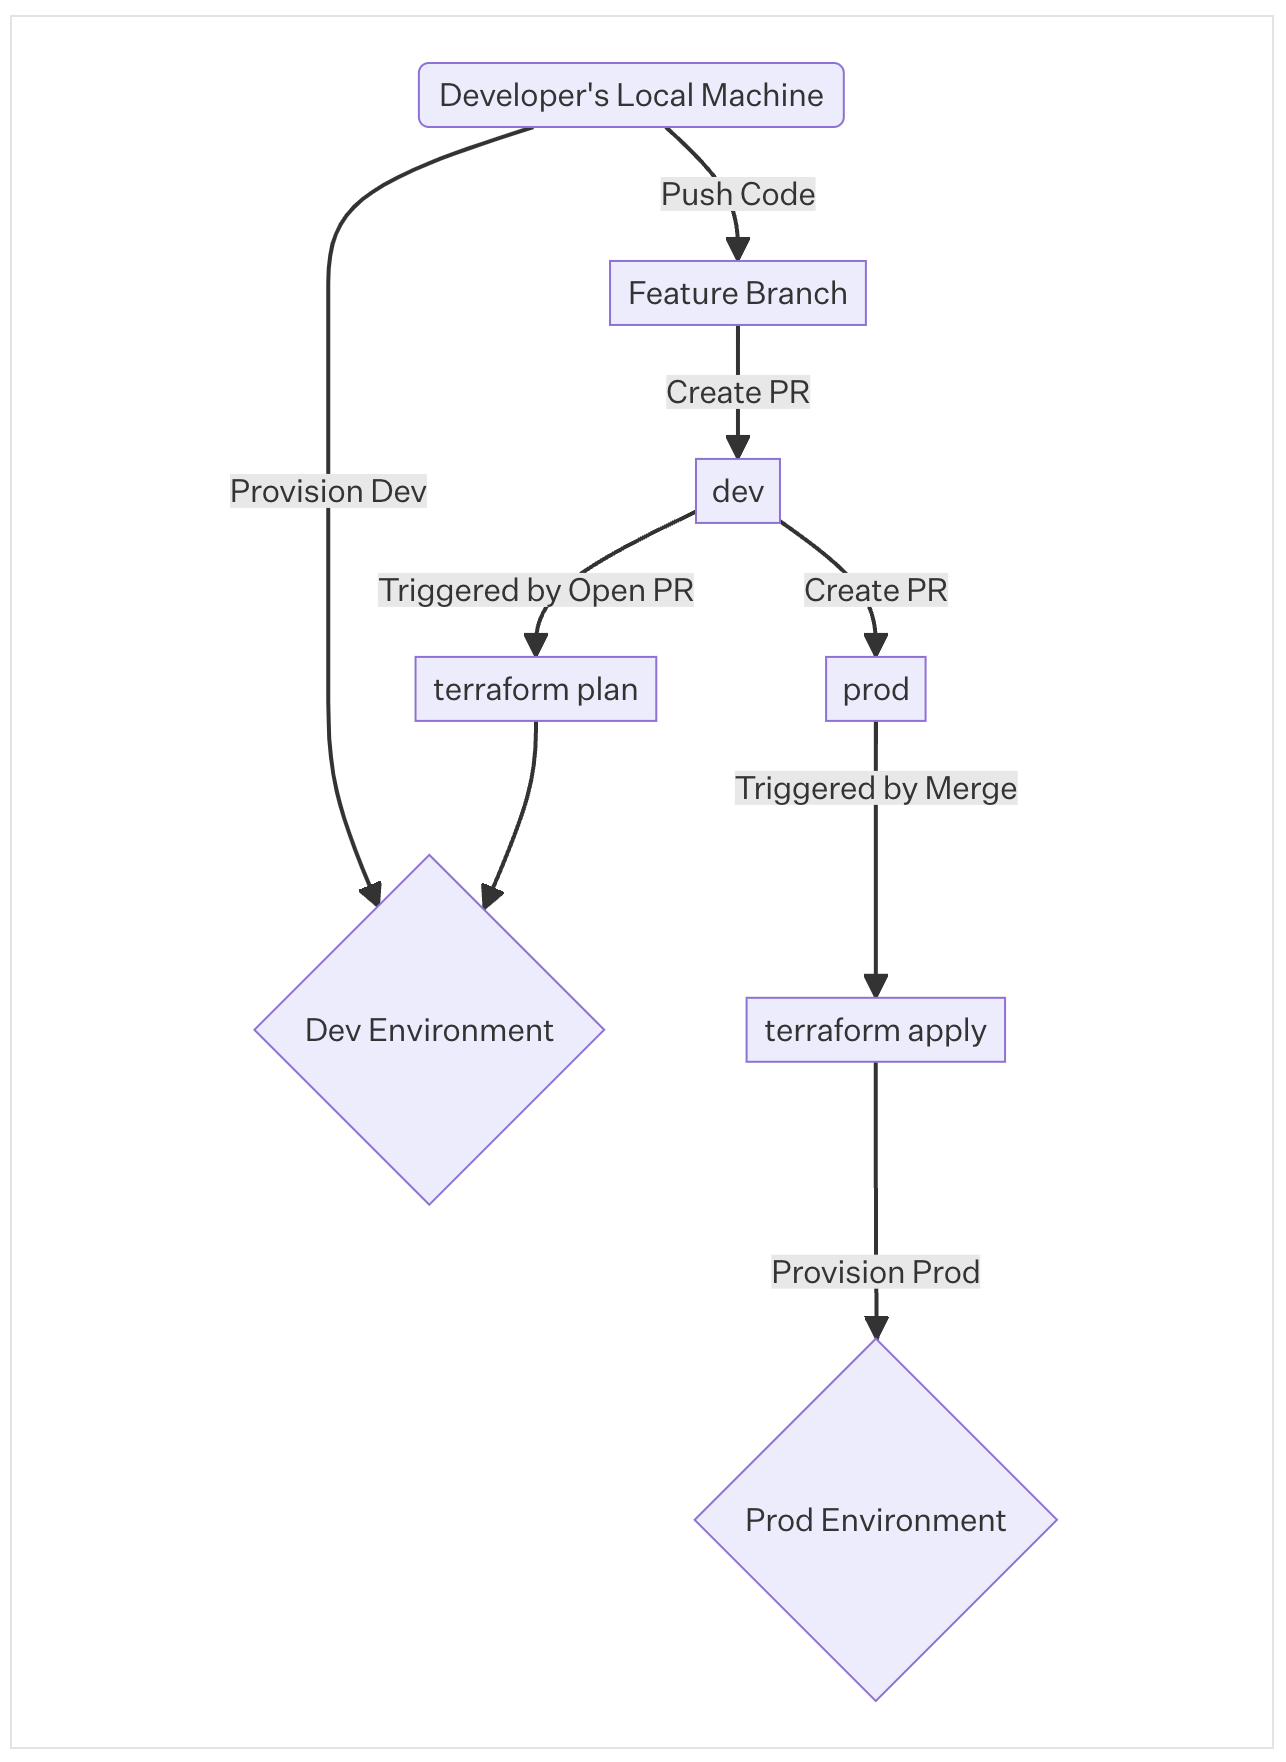
This week, we added an OIDC provider to serve federated requests from GItHub to enable foundational infrastructure such as the Kubernetes cluster, VPC, and base IAM roles to be managed automatically via GitOps in our Prod Environment. This workflow ensures that all changes receive peer review and are provisioned from a central, single source of truth. When making changes to the infrastructure, Developers can quickly iterate in dev from their local machine, then open a pull request agains the prod branch. Once approved, the GitOps pipeline automatically provisions the production resources.
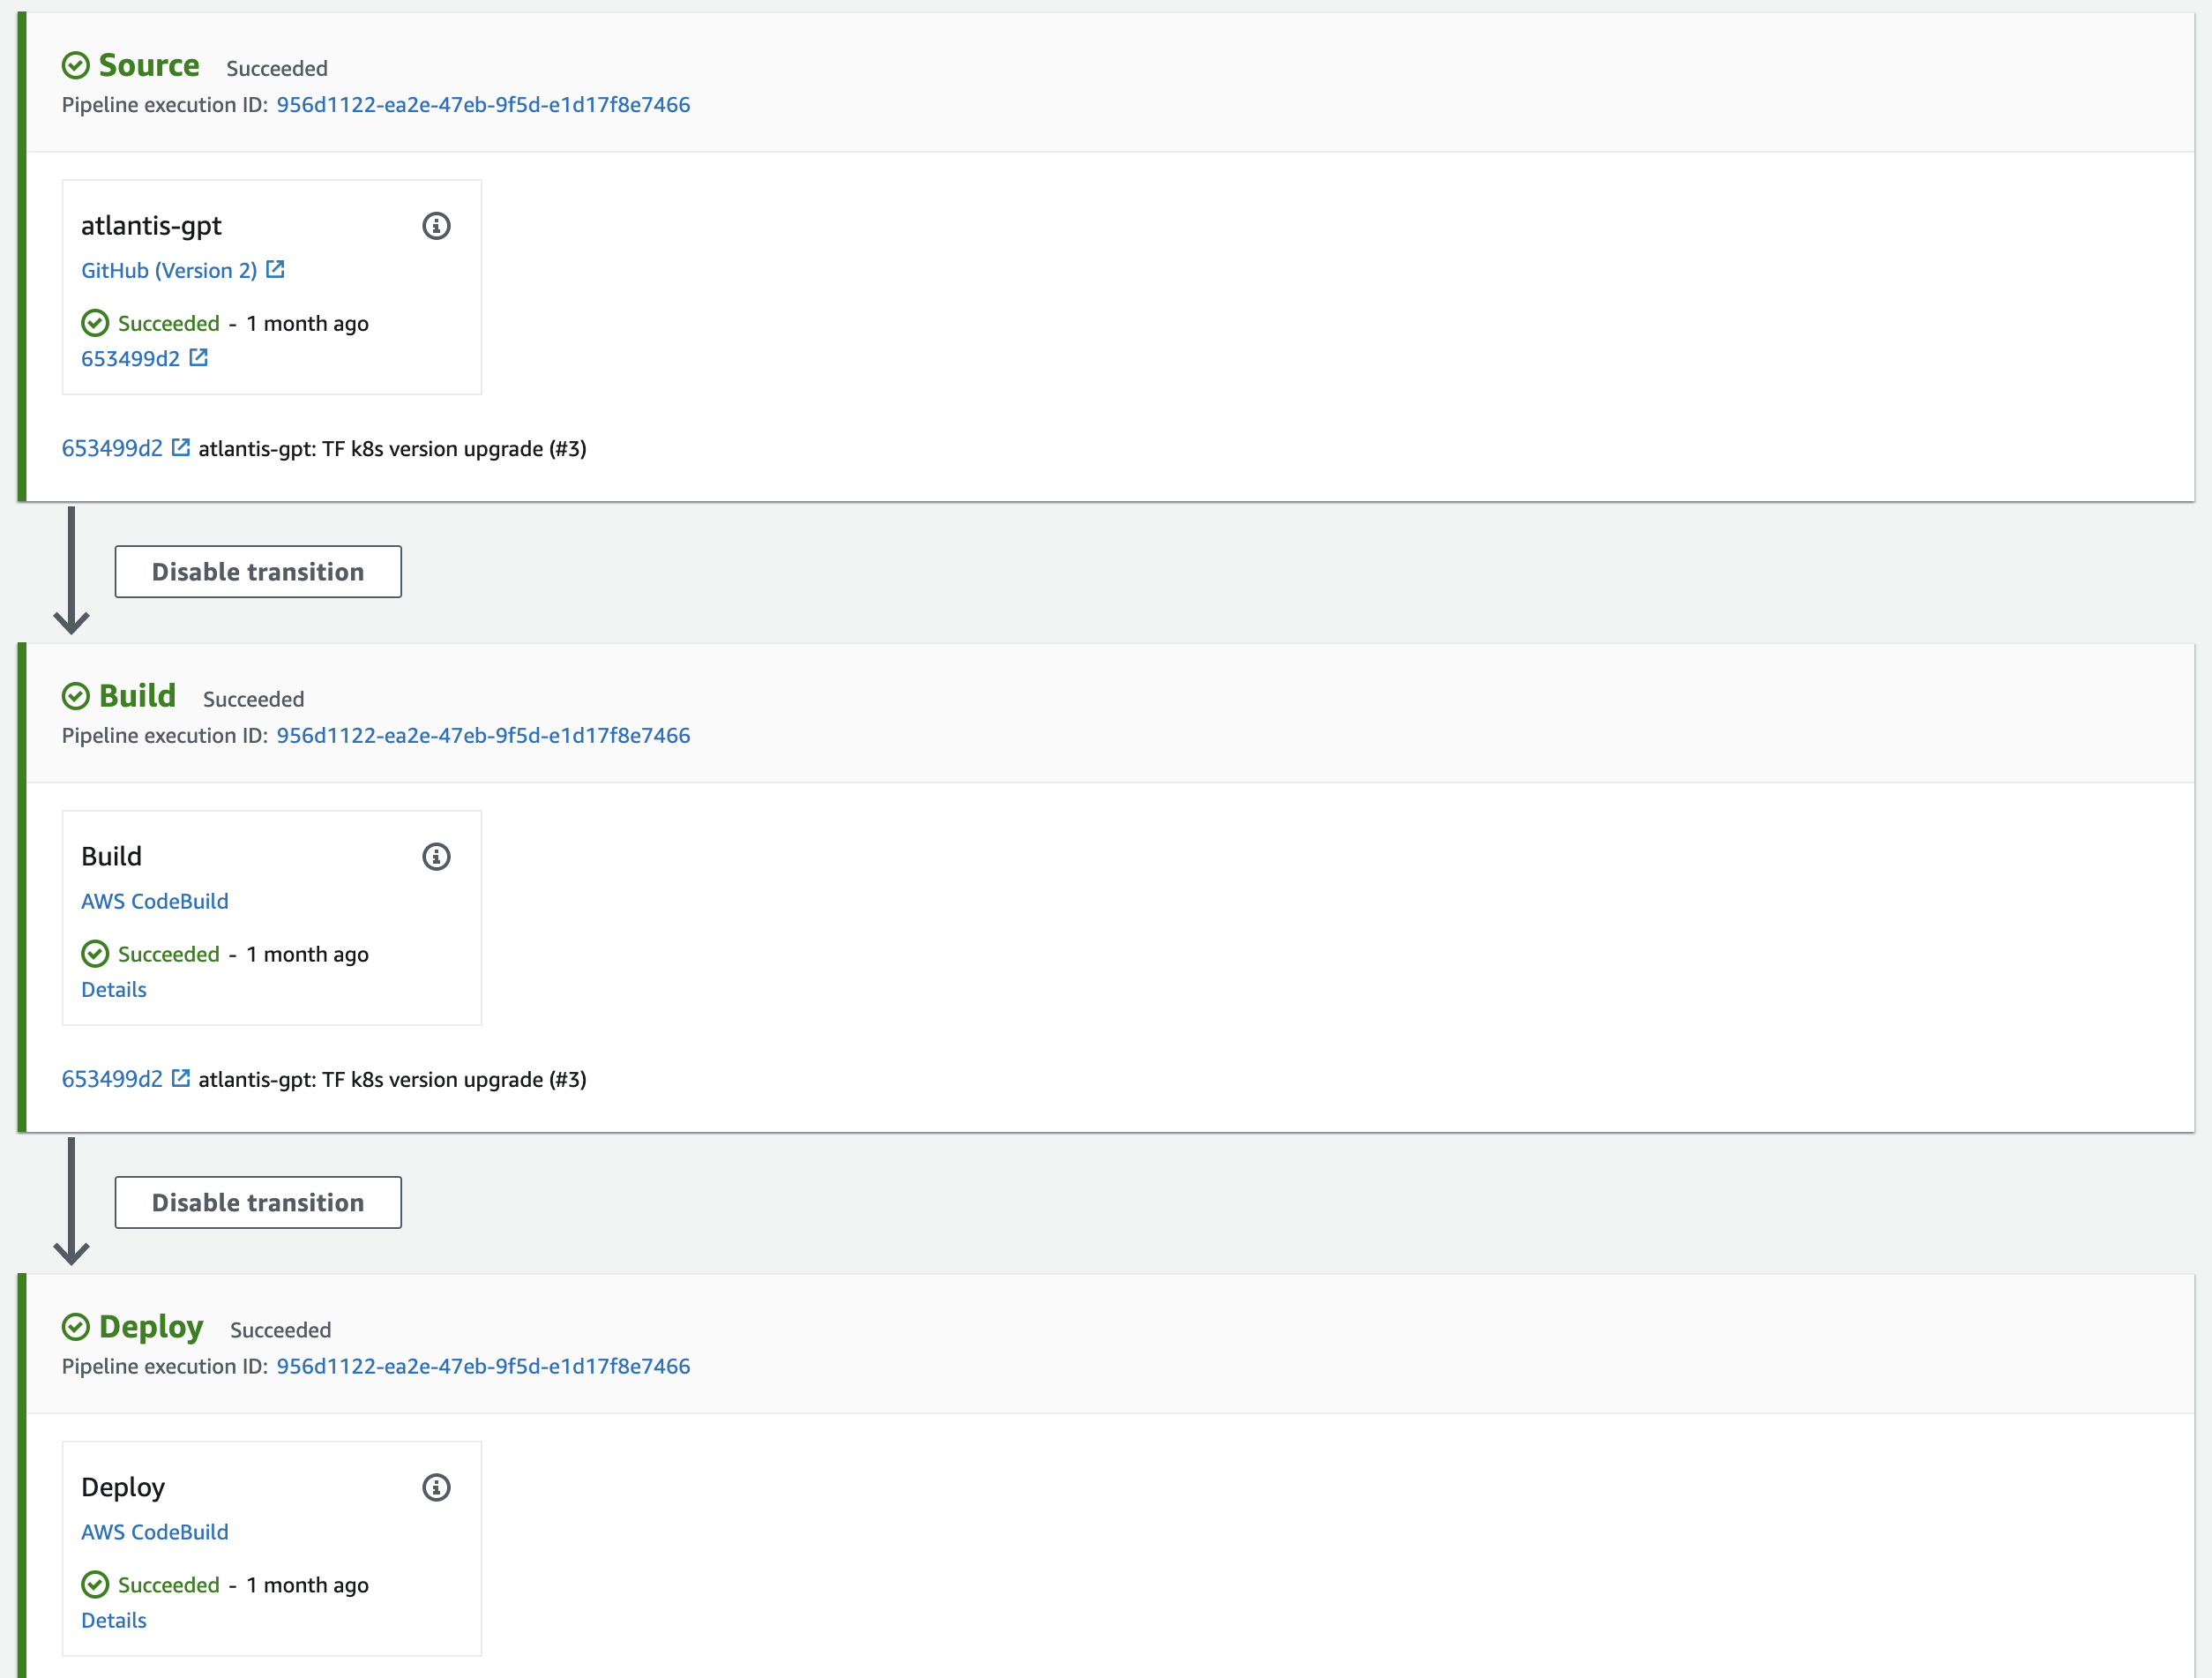
An AWS CodeStar connection was added as a connector between our AWS and Github Accounts to enable continuous deployment in AWS CodeBuild/CodePipeline. The pipeline monitors pushes to the main branch on Github, automates the docker build process, and deployment.
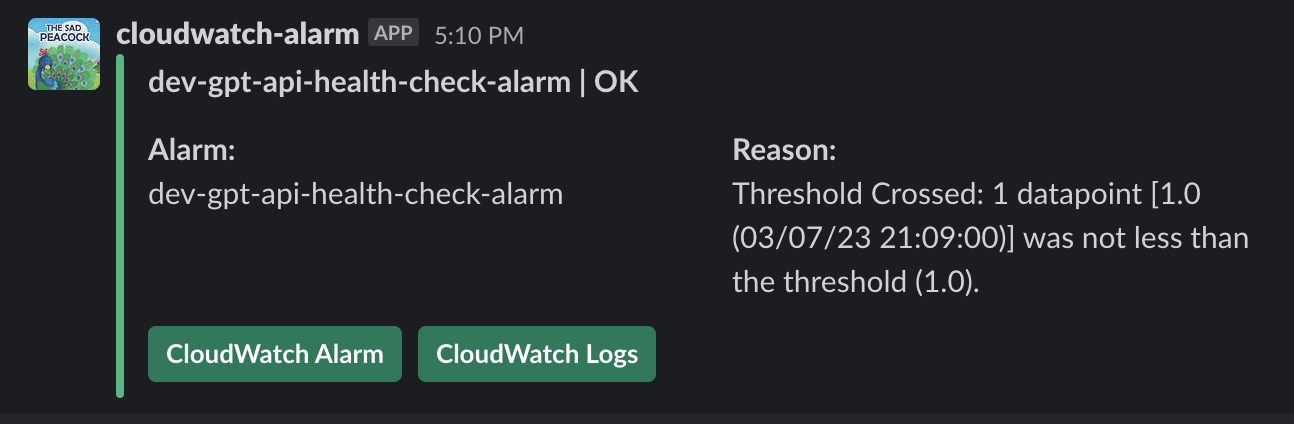
Additionally, the team connected the CodePipeline “Pipeline Succeeded” action via an AWS Chatbot to automatically post in Slack whenever the Pipeline succeeds or fails. On a successful pipeline run, the team is alerted that the new application code has been deployed to the cluster. In the rare event of a pipeline failure, the team is able to quickly respond, debug, and resolve.
CloudWatch alarms have been configured with Slack integration for instant notifications in the event of an Alarm. Depending on the alarm, we have also enabled notifications for an OK state so that the team is notified when situations are resolved. An example of an alarm that would not alert an OK state are those that alert on certain log errors.
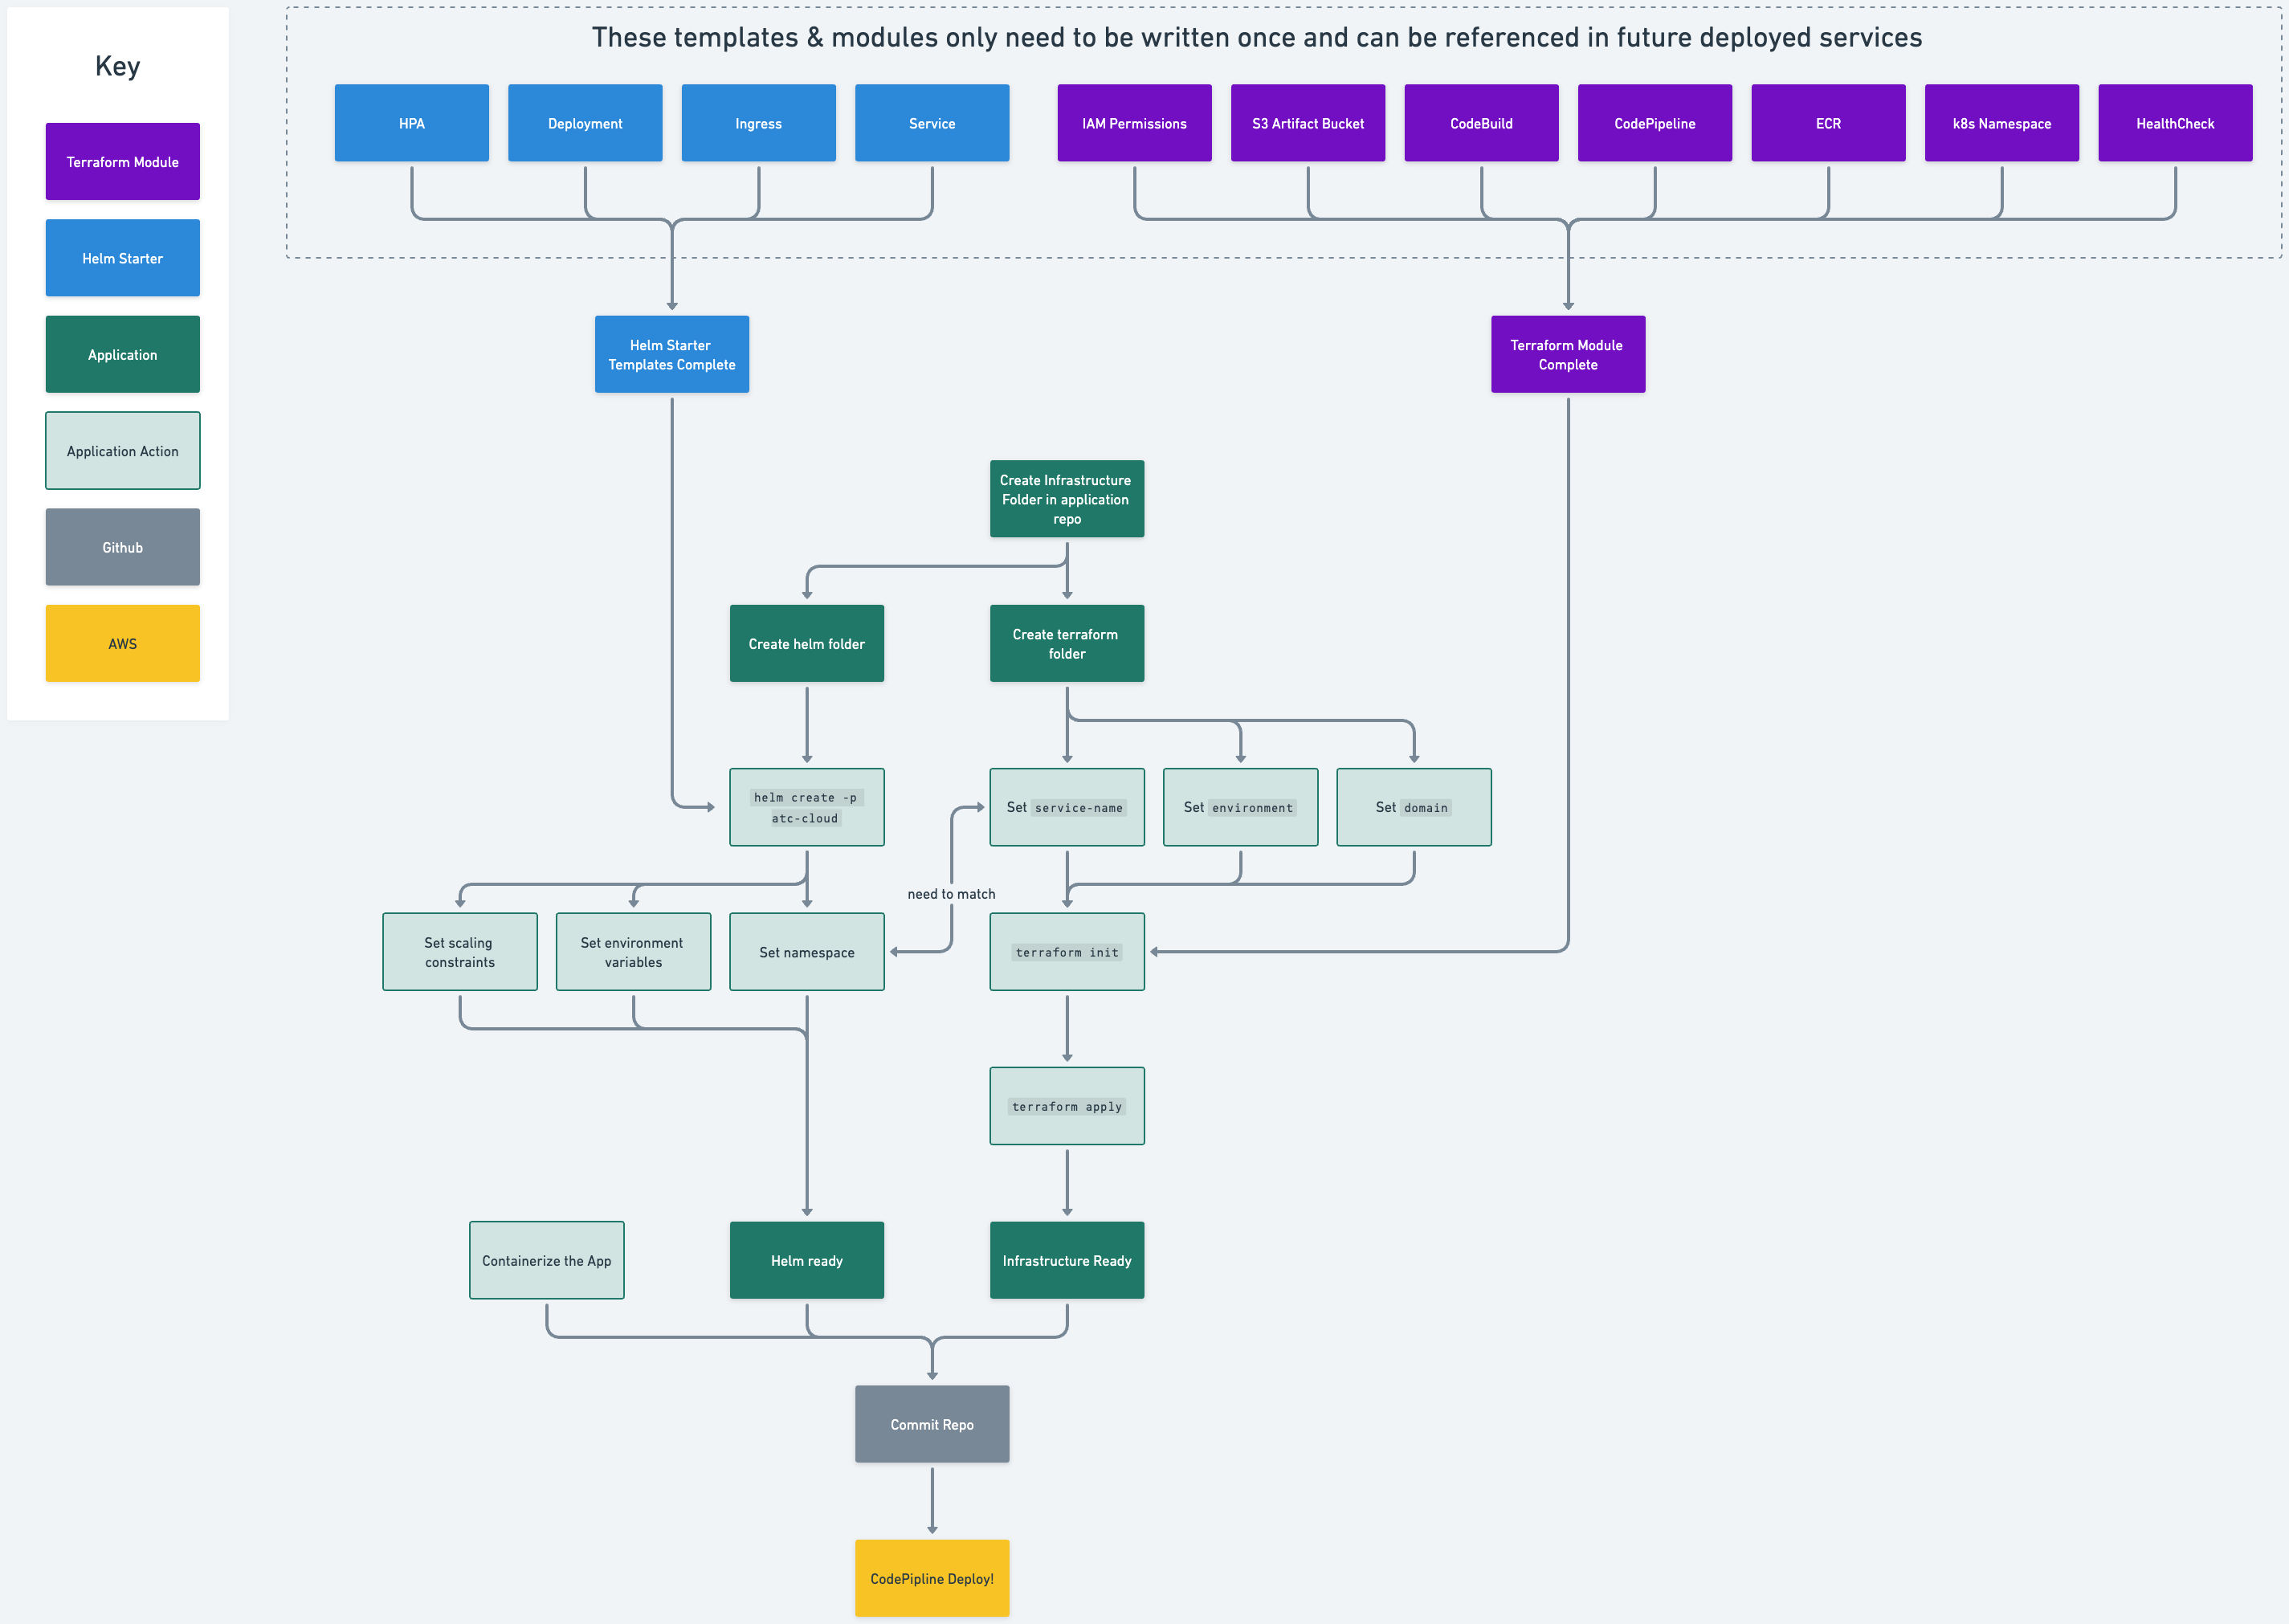
With the addition of the AWS CodeBuild and CodePipeline resources, our service infrastructure Terraform module is nearing completion, and provides the foundation for rapid deployment of new services to our cluster. The GPT API is the first service wrapped with this module, and has enabled valuable iterative learning. Once complete, future services deployed to the cluster will be enabled with full CI/CD, security, and IAM permissions simply by referencing the module.
Additional Resources
We’ve compiled a collection of additional resources for those who would like to dig deeper on the topic of LLM architecture and community direction.
Providing additional context to business stakeholders will be extremely valuable as there is a lot of confusion as to what LLMs and AI can accomplish.
- Emerging Architectures for LLM Applications from Andreesen Horowitz
- AI’s next battle: open or closed from Axios
- What Is ChatGPT Doing… and Why Does It Work? from Stephen Wolfram
Upcoming & Recommendations
Our priority remains creating a rich and consistent user experience. To this end, next week we will focus on completing the Zep implementation to leverage chat history and sessions as context, as well as moving Upload and Ingestion into its own workflow and away from the primary interface. Together, these will provide a better and more focused user experience to our end users.
The new Azure compute instance has been ideal for the current development phase, but as we scale we’ll want to continue evaluating Microsoft’s inventory of GPU enabled servers (currently limited) and seek out additional hosting options. Thanks to our current deployment strategy, we can easily move from provider to provider.
It’s worth noting that new features and functionality (such as a drawer for managing history and sessions) may complicate the UI/UX and require additional design resources to be added to the project. Next week we’ll generate a Product Requirements Document that outlines the pros and cons to be reviewed with stakeholders. This pragmatic approach will enable informed decisions.
As for Infrastructure and DevOps, we will begin expanding beyond traditional alarm metrics (such as CPU) into HTTP Health Checks, Cluster monitoring, and critical error logs. Additionally, we’ll build integrations into other alerting mediums such as SMS or Email, using PagerDuty, which is a proven industry standard.